Contour plots
import matplotlib.pyplot as plt
import numpy as np
from scipy.ndimage.filters import gaussian_filter
# Generate data for the plot
x = np.linspace(0, 1, 50)
y = np.linspace(0, 1, 50)
r = np.random.RandomState(42)
z = gaussian_filter(r.random_sample([50, 50]), sigma=5, mode='wrap')
z -= np.min(z)
z /= np.max(z)
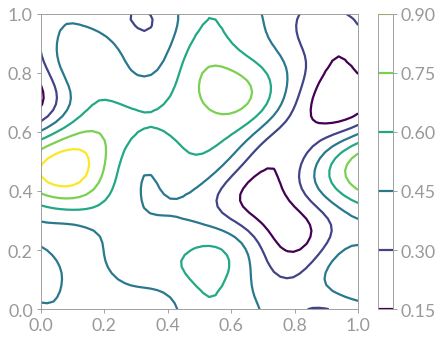
# Generate the plot
fig, ax = plt.subplots()
cmap = ax.contour(x, y, z)
fig.colorbar(cmap)
plt.show(fig)