Scatter plots
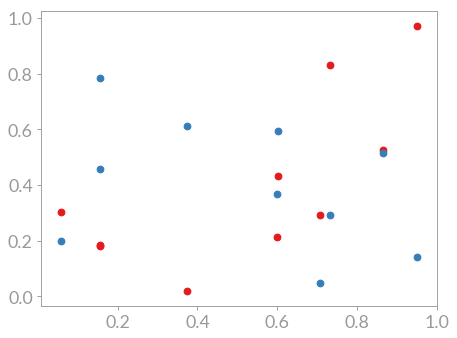
When your data does not have a sequence but is still characterized by data
points a so-called scatter plot is the plot of choice. The command is
scatter() and when used like this
import matplotlib.pyplot as plt
import numpy as np

# Generate data for the plot
r = np.random.RandomState(42)
x = r.random_sample(10)
y0 = r.random_sample(10)
y1 = r.random_sample(10)

# Generate the plot
fig, ax = plt.subplots()
ax.scatter(x, y0)
ax.scatter(x, y1)
plt.show(fig)
it results in a plot showing the different data point groups: