Line plots
The most common plot you see in scientific publications may well be a so-called
line plot. The command for line plots is plot() and
using it like this
import matplotlib.pyplot as plt
import numpy as np
# Generate data for the plot
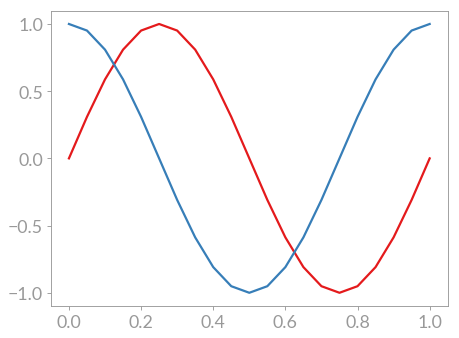
x = np.linspace(0, 1, 21)
y0 = np.sin(2*np.pi*x)
y1 = np.cos(2*np.pi*x)
# Generate the plot
fig, ax = plt.subplots()
ax.plot(x, y0)
ax.plot(x, y1)
plt.show(fig)
results in a line plot with both the sine and cosine: